
More and more of our economy revolves around information technology. A handful of tech giants have experienced unprecedented success in seizing control of large parts of our increasingly internet-dependent economy in just a few years. This trend is only going to increase.
Technology businesses can make excellent investments – many are inherently highly profitable and can scale very quickly. However, assessing the valuation of this sort of high growth business can be challenging.One of the most important and obvious determinants of valuation that seems to get less attention than it should is what the growth profile will look like. Is it likely to accelerate or decelerate and how long will it persist?
How multiples can be misleading
To assess valuations correctly, you need to be able to account for future growth and profitability and know how to discount an uncertain future. This inherently requires speculation. To avoid the unnecessary complexity of a full-blown valuation model powered by guesswork, it can be easier to rely on valuation multiples. In principle, you can then use your intuition to mentally account for the various nuances that multiples fail to pick up. But you can only really be confident your intuition is reliable if you understand the underlying drivers of valuation and how they fit together.
Let’s start with an example of how simple intuition can lead you astray. Say one day you come across an attractive-looking growth business: highly profitable, growing quickly, with a good runway ahead of it and an apparently sustainable competitive advantage. Unfortunately it looks a touch expensive, trading on a multiple of 30 times earnings. You put it on your watchlist for now, hoping that there will be a better opportunity to buy in the future when the valuation multiple has fallen.
Five years later, you look at the business again and rue the fact that the share price has gone up by an astonishing ten times. Most of this rise has been driven by growth in earnings – over five years earnings have increased by 400% (a compound growth rate of nearly 40%). The rest of the rise reflects an increase in the valuation multiple – it’s now on an astronomical looking 60 times earnings. In hindsight you realise it was actually very cheap five years ago after all. But now it must be too expensive – the valuation is much higher, while the business is much bigger and that growth rate is surely going to slow down. It would be mad to buy it now.
Another five years later, you check again and lo and behold the share price has doubled. A respectable return and surprising given how expensive it had looked. Growth has been slowing down recently but the compound growth rate has still averaged out at 30% over the five years. The valuation multiple has fallen back to around 30 times earnings. You think maybe this could be a bargain for what has clearly proven itself to be a long term winner. You buy.
A further five years and earnings growth has slowed down more than you anticipated to a respectable but more pedestrian 10%. The valuation multiple has fallen along with the declining growth rate and the share price hasn’t ended up making any progress at all.
I think this example is fairly typical of the kind of growth profile I often come across when looking at technology stocks. One thing it illustrates is the danger of over-extrapolating growth, which at some point will invariably slow. When this happens the share price can get hit hard as the valuation multiple compresses. This is a popular idea that has been relentlessly applied to describe the apparent overvaluation of technology stocks. While it is probably true that growth will be over-extrapolated at some point, the trouble is that it’s not clear in advance when this will be.
Several years ago many people were making the very same arguments about technology stocks being being grossly overvalued. With the benefit of hindsight, we can now see that these arguments were incorrect. For example, have a look this article from 2014. The author suggested that four popular technology stocks were ‘egregiously overvalued’ on the basis of high price to sale ratios, with the market caps being as much as twenty times revenues. However, following the article, three of the four turned out to deliver returns well in excess of the S&P 500’s 63%: ServiceNow (564%), Splunk (139%) and Tableau (249% before being acquired by Salesforce last year). The price to sales multiples have not changed much. It seems that the valuations of these businesses in 2014 may have substantially under-extrapolated the growth rates that transpired. Twenty times sales for these businesses turned out to be a bargain. Of course, when revenues are growing at more than 40% a year, it doesn’t take long for the multiple to collapse or the share price to rocket…
I’m not trying to argue that investors generally tend to under-extrapolate growth, though this has tended to be the case for many technology stocks in the recent past. I’m just trying to illustrate the challenge of trying to rely on valuation multiples without some accompanying insight about the future growth profile. Without this we can’t really tell whether technology stocks are overvalued now or not.
Growth profiles: the s-curve
So how do you generate insight into what the growth profile for a technology business will look like? This relates closely to what I think of as identifying ‘quality’ – the factors that predict the certainty and extent of growth in long term profits. I’ve written previously about how to identify quality. For low quality businesses growth can be fleeting and hard to predict. However, if you have a business that can generate healthy profits from its investments and is protected from competition (these are a big ‘ifs’!) then it can grow far into the future, as long as there are new customers to sell to or opportunities to invest in. And this is the point I want to get into here – even the highest quality businesses will face limits to their growth at some point. How should you take this into account?
The growth profile typically experienced by this sort of business is the ‘S-curve’. Growth initially starts off slow but then accelerates as the product gains traction with customers and the business takes advantages of the investment opportunities available to it. In many technology markets this acceleration is compounded by network effects or other data-related scale advantages as the product is more widely adopted. At a certain point growth then starts to decelerate as some sort of capacity constraint starts to bite. Typically this is when new customers and opportunities for profitable investment start to run out and the business is forced to butt heads with rivals in pursuit of further growth.
S-curves are a natural phenomenon that occur in many other contexts where there is exponential growth (eg the spread of a virus). Capacity constraints apply to pretty much every exponential growth process in practice – everything is bounded by the limits of a finite world.
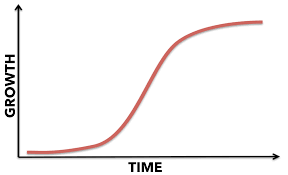
As an investor you ideally want to invest in growth businesses that are relatively early on in their s-curve, before they start to reach the limits of their addressable markets and growth starts to decelerate. After this point the risk that the market starts to over-extrapolate historic growth rates rises.
It can be hard to identify these limits in advance, though you may be able to gain some insight from looking at at the rate of change in historic growth. Because the shape of the s-curve is driven by the natural process of exponential growth hitting a capacity constraint, deceleration will often happen gradually rather than abruptly. This means that typically there should be a warning sign from growth rates starting to decelerate gradually rather than a sudden halt.
The table below shows revenue growth rates for thirty of the largest enterprise software businesses over the last few years. Growth rates can fluctuate from year to year, so looking at several businesses over a few years should help filter out some of the noise. I think looking at the largest businesses is most useful to get a sense of impending capacity constraints for enterprise tech as a whole. I’ve colour-coded to show where growth is accelerating (green), decelerating (yellow) or negative (red). Note I am looking at whether growth is accelerating in absolute terms. I’ve ordered the businesses by price to sales ratio with the most expensive at the top. Unsurprisingly, these tend to be the faster growing businesses.
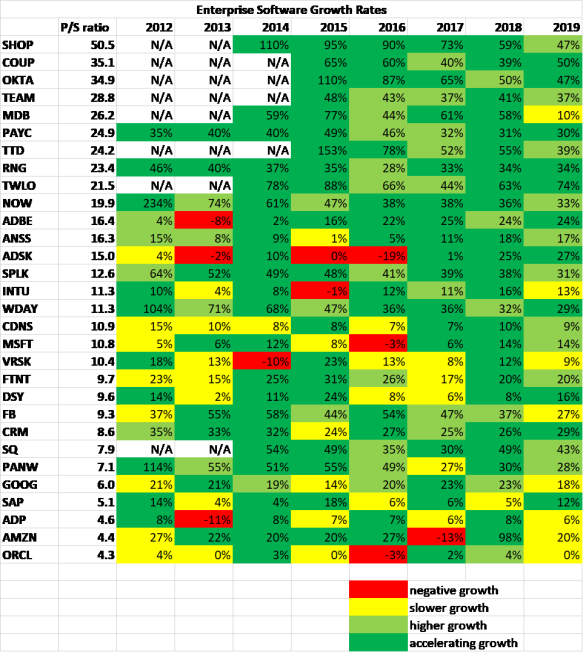
Many of these valuations look expensive. Some of the price to sales ratios need a lot of extrapolation to justify – nine of the faster growing businesses are valued at over twenty times sales. While many are growing fast enough to bring these valuation multiples down fairly quickly, this is still a big ask. These businesses are much bigger than they were a few years ago and maintaining high growth rates will become more challenging.
On the other hand, there isn’t much sign that we are yet hitting the inflection points where growth starts to decelerate. A minority of the more mature businesses have slowed down but most have been achieving consistently high growth rates for several years and are still growing rapidly. Revenue growth continues to accelerate overall.
Fundamental drivers of the addressable market
While there aren’t signs that growth in enterprise software is starting to decelerate yet, you can’t tell just from historic growth how far ahead the inflection points will be. To get a better sense you need to dig a bit deeper into the fundamental factors that determine how big the addressable market will be and how successful the business will be in exploiting it.
Conceptually, you can think of two sets of factors: those that determine the growth profile of the market as a whole and those that affect the relative success of the individual businesses within it.
Obviously it helps a lot to invest in markets experiencing sustained secular growth where the opportunities are huge and the limits are not obviously in sight. On these terms enterprise software is just about the most attractive sector there is. According to Gartner the overall sector has been growing at an accelerating rate in recent years and, up until the Coronavirus, was expected to grow at more than 10% for the next couple of years. Within this obviously some markets are growing much faster than others. Some of the larger, more mature businesses are growing more slowly or are even ex-growth. This pulls the average growth rate down (as you can see from the table above).
The high growth in overall demand for enterprise software is a favourable tailwind for all the businesses within the sector. I think it still has a long way to go. Adoption by many parts of the global economy is still relatively low. As I have suggested previously, the potential for information technology to add value to how businesses organise themselves and execute their strategies just seems enormous and continually growing.
Assessing the growth prospects for individual businesses is rather more challenging. Properly understanding the extent of growth runway and the competitive dynamics for an individual business requires detailed research. Reliable information can be hard to come by if you’re not an industry insider. However, there are some risks to bear in mind common across most high growth technology markets.
One is the risk of technological disruption. Many enterprise software businesses benefit from apparently strong competitive advantages in the form of barriers to switching, scale advantages or network effects. However, in many cases this might not provide as much protection as it seems from paradigm-shifting advances in technology. For businesses unable or too slow to adapt, the effect of this kind of disruption can be to dramatically pull forward the deceleration of growth that would otherwise occur more gradually along the s-curve. This risk is common to most high growth technology businesses and should be reflected in valuations.
The obvious recent example in enterprise software is cloud-computing. Cloud-computing has allowed for the exploitation of huge economies of scale and scope in processing large quantities of data on behalf of multiple parties and allowing better interoperability between multiple services. This has dramatically altered the economics of many enterprise software markets. It has contributed to many new businesses or those who adapted better (eg Salesforce, Microsoft) stealing a lead on some of the old guard who were slower to adapt (eg SAP and Oracle).
Another important idea is that there are advantages to combining complementary technologies through a common platform (similar to the idea of ‘aggregation theory’). In consumer markets these advantages are driven by convenience, as consumers find it easiest to meet multiple needs from a single access point, say Google’s search engine or Amazon’s retail platform. The convenience and improved interoperability of sourcing an integrated set of software services from a one-stop shop is also important to business customers. This can be exacerbated as powerful technology platforms have strategic opportunities to ensure that their own services interoperate better with each other than with those of rivals. In the longer term these competitive dynamics can be very powerful and can drive a substantial advantages to platforms able to aggregate multiple services. Ultimately, this can lead to a ‘winner-takes-all’ type of competition. This creates a strategic advantage for the larger players, such as Microsoft.
Implications for investing
When dealing with high-growth technology investments it can often make sense to buy earlier on in the s-curve when growth is accelerating, regardless of the valuation multiple. Whether the business is likely to be a winner tends to matter much more than the valuation multiple.
While several years of growth can make quality more apparent, it also brings closer the inflection point at which growth will start to decelerate. The risk that growth is over-extrapolated starts to rise. The valuation may fail to reflect the risks from disruption or the competition from larger competitors with strategic advantages. It makes sense for investors to become more cautious about valuations as businesses get bigger over time and particularly if there are any signs that growth is starting to decelerate.
So while it’s more difficult to be confident at an earlier stage that what you are buying is quality, buying earlier takes advantage of the tendency for investors to under-extrapolate growth and reduces some of the risks that growth will decelerate soon. This is the trade-off you face when investing in this sort of business. I’ve tended to err too much on the side of ‘cautiously’ waiting for quality to be more proven and the valuation to become less demanding, without really understanding the trade-off well. It’s a common mistake – I think many previously highly successful investors, notably Warren Buffett, have failed to fully grasp the changing dynamics of technology-driven markets.
Finally, I think these dynamics also provide (yet another) rationale for following momentum. Following momentum takes advantage of the tendency of investors and share prices to under-react to accelerating growth early on in the s-curve and to decelerating growth later on.

Thank you for an (another) excellent article. I and several of my private investor colleagues read with interest the measured and thoughtful articles on your blog. We are all struggling to find a means of navigating the post Covid ‘new normal’ where the SaaS business model will sustain but we are all feeling for the right buying price metric. The rule of 40 seems to have replaced P/E as our new yardstick but in this ‘wild west’ stage where claims are being staked most of us are open to new ideas.
LikeLike
Thanks for the kind words Christopher.
I neglected to mention the rule of 40. The analyst in me found it hard to stomach the idea of adding a profit margin % to a growth %, so I’ve never really taken it seriously before. On reflection, I think it may have some merit as a practical rule of thumb (though it obviously has its limitations)…
LikeLike